Introduction
The use of a system of differential equations to model the epidemiological dynamics of diseases across human populations has lately gained prominence. Several scholarly articles with SIR-type models of different infectious diseases have been developed (Tang et al. 2020). This has come to light in great part due to the global epidemics of Covid19 since early 2020. References to models from different researchers and institutions have anxiously focused on predicting the waves of cases, hospitalizations, and deaths. Questions like how, for example, isolation and quarantine would affect the dynamics of the disease were analyzed. Beyond the fear and concerns of the pandemic, the rise in prominence of these models have also extended into the public’s discourse. Otherwise obscure technical terms like “flattening the curve,” “herd immunity,” “reproduction rate”, “Ro,” among others, have become common terms used by the tv hosts, journalists, and people often without the correct interpretation or with lack of basic comprehension.
Concept Box 1. SIR refers to an infectious disease epidemiological model that at each point of time estimates the number of people from a given population who could be either susceptible to, S(t), infected with, I(t) or recovered from, R(t), an infectious disease; ergo its name is read S, I, R. Moreover, each letter in SIR is a differential equation that changes with time, t, and so the three equations form a system of differential equations, ergo the SIR model or SIR-type model.
Yet, researchers, epidemiologists and public health officers have been using SIR-type models to guide health policies for quite some time (Luz et al. 2010; Chowel et al. 2016; Opatowski et al. 2018). Specifically, these models have already been used for the design and evaluation of control and prevention strategies in respiratory diseases (Scherer et al. 2002; Smith et al. 2010). However, little is known by the layman about how these models work, what their strengths and limitations are, how useful they are for disease surveillance and how effectively they measure the effectiveness of control and prevention strategies. Without diving into technical concepts and features, this article aims to provide a brief description of these models as well as their strengths and limitations in the investigation and control of respiratory diseases.
A typical SIR model
Many names for a model: Various terms have been used to name these models and could cause confusion about whether one is referring to the same or different one. Among these terms are “Dynamic models,” “Mathematical epidemiology models,” “Compartmentalized models, “Disease transmission models,” “Transition dynamic models,” “Group-structured epidemic models,” etc. In general, it could be said that these models are at the same time dynamic, mathematical, compartmentalized and describe disease transmission through rates of transitions among compartments (Chowell et al. 2016). Each one of these terms could well be used to describe these models.
However, the term that has gained more traction is SIR-type models for how the name describes the structure of the models. We will use this term along this article under the understanding that we are referring to the other terms as well.
Structured SIR model: Among these models, the one with the simplest structure is the SIR model. Precisely, SIR stands for Susceptible, Infected and Recovered compartments (Figure 1). The names of these compartments are describing the health status of a fraction of a given population, when considering a specific infectious disease (Tang et al. 2020). Specifically, given an infectious disease, at a point of time a fraction of the population is susceptible, another fraction is infected and another one recovered, making the sum of the three compartments up to the total population size, N, namely, S + I + R = N. Namely, these compartments describe mutually exclusive groups of individuals.
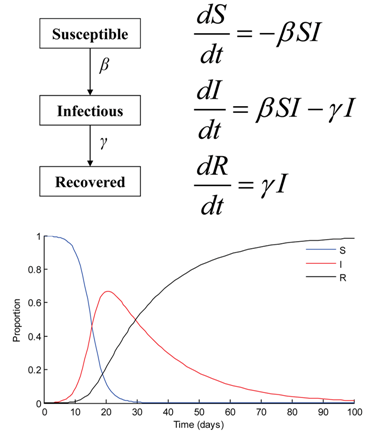
At an individual level, it could be said that the health status of a person is either susceptible, infected or recovered; namely a person’s health could not be in two compartments at the same time. Now, the transmission or the dynamics feature happens in intervals of time; namely, in an SIR model it is through time how parts of a population (or the probability that an individual) transitions from being susceptible to being infected and then to being recovered. In this example presented in Figure 1, the entire population becomes infected and eventually recovers.
Concept box 2. Each step along S, I or R disease status and transitions follows a specific rate in time: an infection rate that depends on the effective interaction between susceptible and infected individuals, , from susceptible to infection and a recovery rate, , from infected to recovered (Tang et al. 2020). A system of three differential equations with S, I and R as time-dependent variables and with transition rates as function parameters could be built along with initial conditions and balances.
Incrementally complex models
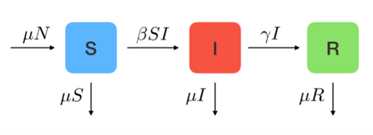
The model in Figure 1 is the simplest SIR model and helps only to illustrate the disease dynamics. Two additional components: the birth rate and the mortality rate provide more practical use. SIR models often assume a birth rate that increases the size of the population and usually it is an addition to the “Susceptible” compartment, meaning that all new births are susceptible to the specific infection disease. SIR model also distinguishes two types of mortality rates: one caused by factors other than the specific infectious diseases in the model, , and the second is the rate of death explicitly attributable to the infectious diseases being modeled, .
However, adding mortality to SIR models is just one thin layer in the many other more complex configurations. SIR models become incrementally more complex in different ways depending on how the infectious disease behaves in the population. These variations are called SIR-type models. Among the many factors determining the model configuration, three are the most frequently observed: clinical course of the disease, demographic-driven modifications, and different disease risk conditions among groups in the population (Purkayastha et al. 2021).
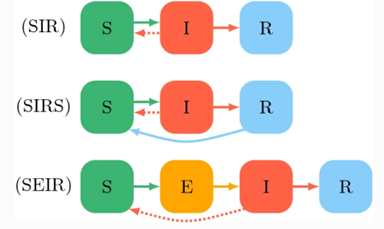
Among SIR configurations based on the clinical course of the disease is, for example, the SIRS models (Figure 3, mid-section). In general, this configuration is used to capture how the immunity gained by those who recover from infections wanes in time and, thus, makes them susceptible to reinfection (blue arrow from R to S). This clinical feature has also and often been observed in respiratory diseases when new variants of the pathogen causing the disease mutates significantly as in the annual influenza epidemics or as in the variant-driven waves in Covid19.
By the same token, a SEIR configuration (Figure 3, bottom) is used to model diseases like Covid19 when susceptible individuals are exposed to the pathogen causing the disease, but due to the clinical course of the infection (i.e., duration of the incubation period) or due to individual characteristics such as immunological conditions, may potentially result as infected or not. Also, when information about being exposed is known and individuals modify their behavior, i.e., self-isolation, until the infection diagnosis is confirmed or rejected.
One of the most frequent demographic-driven modifications is the age-structured SIR model (Figure 4). The main reason for an age-structured SIR model is the differential behavior of infection (or course of the disease) and impact across age groups. This feature implies, among other characteristics, that different rates for each age group of either infection, recovery, or disease-caused mortality rates (or rates of other outcomes such as hospitalization) could be attributable to the same pathogen (Brand et al. 2020). Moreover, the interaction between different age groups could produce differences in the probability of transmission and infection. Facts like these have been observed in seasonal influenza as well as in Covid19 when the transmission and mortality seem to be different for different age groups. As shown in Figure 4, the SIR model includes two sets of S, I and R compartments, each subscript representing the specific population fraction of susceptible, infected and recovered of age group 1 and 2, respectively.
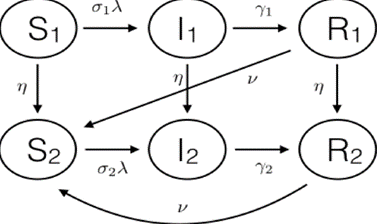
Concept Box 3. Two additional elements: First, is the transition probabilities or rates are specific to each age group and that aging is also represented by the transitions between compartments of susceptible as well as between infected and recovered across age groups. Second, similar to the SIRS model mentioned above, the figure also shows waning of immunity when those who recover from infection become susceptible again to reinfection.
Regarding modifications to the SIR model due to risk conditions among groups in the population, it is possible to have a structure similar to the described in Figure 4. Specifically, instead of age groups, there could be risk groups such as “high risk” for infection and severe outcomes (i.e., immunocompromised) versus non-high risks (i.e., immunocompetent) (Thomas et al 2020). Diseases like influenza and now Covid19 have shown different risks of severe outcomes given infection, like having comorbidities or immunocompromised conditions (Brand et al 2020). Figure 4 could also represent disease differences (i.e., different rates of incidence, prevalence) in the group of healthcare workers versus the general population (Thomas et al 2020).
It should be noted that the systems of differential equations representing the models described in Figures 2, 3 and 4 would incrementally be more complex than the system represented in Figure 1. Specifically, the structure of the three equations in Figure 1 would dramatically change (Chowel et al. 2016, Tang et al. 2020). Moreover, the number of differential equations will increase with the number of compartments modeled and the number of parameters such as the transition rates would also increase proportionally.
Reproductive number and Herd immunity
Perhaps the two most important epidemiology concepts in SIR models are the average reproductive number and the herd immunity threshold. The two concepts are specific to each disease and pathogen.
Concept Box 4. Herd immunity. This concept refers to the minimum percentage of people within a community who need to be immune to an infectious disease in order to reduce the size of the outbreak leading to its disappearance (Law et al. 2021; Royal Society 2020). Alternatively, it could be thought of as the minimum percentage of people needed to be immune to prevent an increasing outbreak. Immunity can occur from either a prior infection or from vaccination.
Figure 5a shows how the herd immunity is achieved when the proportion of those recovered levels out in time. While Figure 5b shows the relationship between herd immunity and reproductive number.
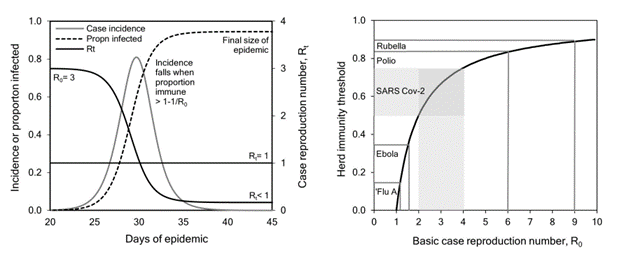
Concept Box 5. Basic reproductive number: The average reproductive number (Ro, pronounced R-nought) is the number of secondary infected cases caused by a single case during the course of the illness in a susceptible population. In simple words, how many new cases would appear for every single infected case is what Ro measures. In the first SIR model (Figure 1), Ro would be calculated as the ratio between β and γ. Naturally, in successive models the mathematical expression for Ro would have to be modified accordingly but would preserve the intuitive definition.
It is known, for example, that measles has a reproductive number of 14.5 (with Ro ranging from 13 to 16), which means that each case of measles could on average infect approximately 14 susceptible persons (Royal Society 2020). On the other hand, influenza and Covid19 have an Ro equal to 1.6 (range 1 to 3) and 2.6 (range 2 to 4), respectively. The key message here is that, when Ro < 1, the disease will eventually perish in the population, and if Ro > 1, the disease will keep spreading faster, the greater this number is.
Although not in a linear fashion, the basic reproductive number and the herd immunity threshold have an inverse relation between them; namely, when the percentage of people in a population immune to an infectious disease increases, the chance for secondary infections decreases substantially. This is seen by the following expression Herd Immunity = 1 + (1/Ro) x 100. In it, we see that the herd immunity threshold is inversely related to the basic reproductive number (Figure 5b). Specifically, when the force of infection substantially decreases down to a point where Ro < 1, (Figure 5a), the disease will perish in the population mainly because the percentage of people immune to the disease is high enough to provide protection to the rest of the remaining susceptible in the population, e.g., indirect protection, which is referred as “herd immunity.”
Using SIR models: control and prevention
Designing a SIR model is further from being just an academic or theoretical exercise. The dynamic features of SIR-type models have been used not only to elegantly describe the epidemiological progression of an infectious disease outbreak in a population, but also to predict its future health burden and progression (Tolles et al. 2020, Xu et al. 2021). They have been used to design practical and effective strategies that reduce the disease burden. Specifically, a SIR model, when properly designed, would be able to measure and predict the health impact of the infectious disease in absence of an intervention (i.e., the model could estimate the number of disease cases, associated hospitalization or deaths) as well as measuring the potential impact of disease control and prevention strategies. In other words, the effectiveness of an intervention would be assessed by the relative or proportional reduction in the disease impact compared to the absence of intervention (i.e., relative or proportional reduction in disease cases, associated hospitalizations or deaths).
Concept box 6. Flattening the curve: At the beginning of the Covid19 pandemic and for months, the “flattening the curve” expression was often heard, mostly as a question, “how to flatten the curve?” Any strategy addressed to control or prevent a disease outbreak or a large epidemic such as the Covid19 could be considered a “flattening the curve” strategy (Figure 6); namely, strategies that leads to the deceleration in the number of cases causing a reduction in their daily and overall numbers during the pandemic (Specktor 2020).
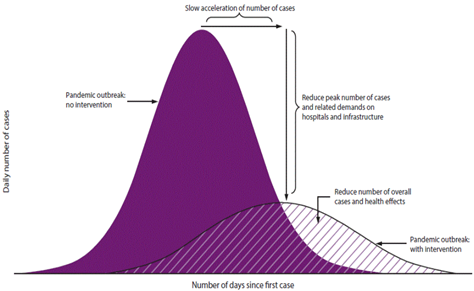
During a large outbreak that overwhelms the healthcare system in a given population, flattening the curve below the healthcare system capacity would prevent its collapse. This becomes crucial when the number of hospital beds, respiratory devices or other resources are limited and when there are no prophylactic methods available such as vaccines, antivirals or antibacterials that could be used to prevent the infections among susceptibles or cure the disease among infected. In the early months of the Covid19 pandemic, social distancing of susceptibles along with wearing masks and hand washing were promoted to reduce the daily number of cases. When exposures happened and infection was suspected, isolation and quarantine were also recommended (Xu et al. 2021). All these non-pharmaceutical-based recommendations sought to decrease and maintain low social interactions within the communities and, by doing so, reduce disease transmission, seeking a low β, which eventually would decrease Ro (Figure 6).
Social distancing: In general, keeping the daily number of disease cases at a manageable level for healthcare providers to be able to provide medical services was desired to be sustainable in time. However, we have seen how healthcare capacity in some places and times was overwhelmed by the high level of new daily cases. In SIR models, social distancing has been introduced following different approaches and could help to visualize where these increases in healthcare demand would happen.
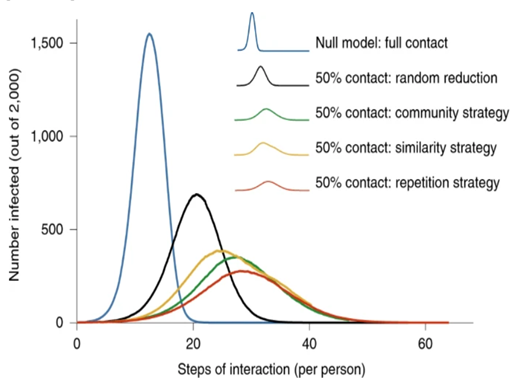
In SIR models, the effectiveness of “flattening the curve” of different contact reduction strategies could have a different impact when compared to no social distancing, i.e., full contact (Figure 7). As we can observe, it is not only the reduction in the frequency of contacts (i.e. 50% reduction in contacts), but also whether the contact is random with any member in the community or repetitive with a selective group in the population (Block et al. 2020). Each type of interaction could significantly affect the shape, size and peak of the flattened curve.
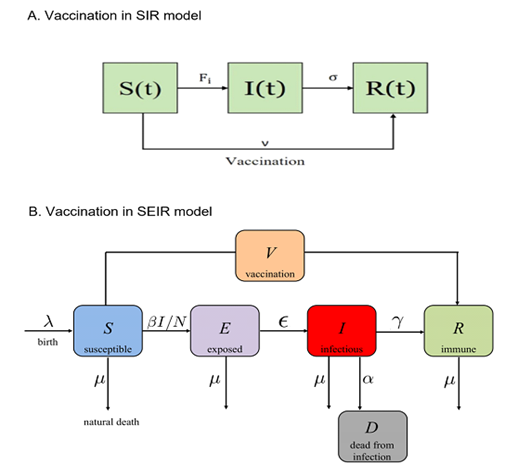
Concept Box 7. Vaccination in SIR models: When available, the most effective strategy to prevent large epidemics of infectious diseases is the use of vaccines. However, vaccines for new and emergent diseases that cause large outbreaks are often unavailable at the beginning of the epidemics. SIR models of infectious diseases can include vaccination strategies and then be able to predict the effectiveness impact of vaccination programs (Scherer et al 2002).
Figures 8a and 8b show the impact of vaccination by either including a rate of vaccination from susceptible individuals to recovered (the SIR model with vaccination rate v, Figure 8a) or by including a new compartment, vaccinated individuals, V, which is different that those recovered (Figure 8b). In both cases, susceptible avoid being infected by being vaccinated.
Take-away message
A SIR model as any mathematical model is a simplification of how the infectious disease behaves in the population. It is suppose to capture the essential elements of a natural phenomenon: the dynamics of an infectious disease in the population. When well designed and calibrated, it could be a reliable tool, a working hypothesis that helps in the prediction, control and management of the disease impact. However, SIR-type models depend on their assumptions and on the data fed to the model (Adamu et al. 2019). The assumptions are usually educated guesses about many key clinical, epidemiological, and demographic components in the model for which robust data are not available. The assumptions are made to solve part of the uncertainty about such components. Assumptions, for example, about how transmission happens in the community versus in healthcare settings or close environments, our assumptions about how a new treatment works or how long the vaccine protection lasts would change the outcomes of the model. When high quality data are available, the model would depend less on assumptions and more on evidence provided by the data (Tang et al. 2020).
It should be noted that if there were enough high-quality data for all key epidemiological components, one could just statistically analyze these data to then guide recommendations (Xu et al. 2021). That would make SIR models less necessary or even irrelevant. However, perfect information is seldom the case in sudden large epidemics of new diseases and so, SIR modeling helps to integrate the scarce data available with well-educated assumptions about those areas where uncertainty remains. In this context, the SIR models could be seen as a state of knowledge in between two learning scenarios: the complete uncertainty where everything is ignored and the full availability of data about the disease in the population (Tolles et al. 2020). In that sense, SIR modeling uses what is known and what is assumed about the disease and its burden to calibrate the model parameters and then see if the dynamics of the model replicates the reality of the disease. Various statistical, numerical and approximation approaches could be used to calibrate the SIR models.
Additionally, one could suspect that there is a minimum of data needed to design a useful SIR model. Among them disease-, country- and region- specific epidemiological data would be required. Also, disease-specific clinical data regarding the outcomes of infections; namely, proportion of infected people fully recovered, recovered with temporary or permanent sequelae or portions of infected who die (Chowell et al. 2016). Along these lines, the specific effectiveness of available treatments, of control strategies like wearing masks, washing hands, or social distancing would also be helpful. Population data such as size of risk groups or age groups would be important when the disease impact is different depending on the risk, age or comorbidity conditions of some groups in the population (Brand et al. 2020).
Overall, SIR-type models of infectious diseases have become important tools. Researchers, biologists, epidemiologists, and public health officers who are focused on predicting, controlling and preventing the impact of large outbreaks or epidemics caused by emerging infectious diseases resort to these models. This article aimed to introduce in no-technical terms the main characteristics and virtues of these models. I do understand that these notes are quite incomplete and only cover a few topics among many related others without going into the complexities. However, the aim is to provide an informal introduction to these models and how useful they could be when dealing with population health events in the future
References:
Adamu HA, Muhammad M, Jingi AM, Usman MA. Mathematical modeling using improved SIR model with more realistic assumptions. International Journal of Engineering and Applied Sciences (IJEAS). 2019. 6. 10.31873/IJEAS.6.1.22.
Block P, Hoffman M, Raabe IJ. et al. Social network-based distancing strategies to flatten the COVID-19 curve in a post-lockdown world. Nat Hum Behav 4, 588–596 (2020). https://doi.org/10.1038/s41562-020-0898-6
Brand SP, Munywoki P, Walumbe D, Keeling MJ, Nokes DJ. Reducing respiratory syncytial virus (RSV) hospitalization in a lower-income country by vaccinating mothers-to-be and their households. Elife. 2020 Mar 27;9:e47003. doi: 10.7554/eLife.47003. PMID: 32216871; PMCID: PMC7556875
Chowell G, Sattenspiel L, Bansal S, Viboud C. Mathematical models to characterize early epidemic growth: A review. Phys Life Rev. 2016;18:66-97. doi:10.1016/j.plrev.2016.07.005 https://www.ncbi.nlm.nih.gov/pmc/articles/PMC5348083/
Law KB, M Peariasamy K, Mohd Ibrahim H, Abdullah NH. Modelling infectious diseases with herd immunity in a randomly mixed population. Sci Rep. 2021;11(1):20574. Published 2021 Oct 18. doi:10.1038/s41598-021-00013-2 https://www.ncbi.nlm.nih.gov/pmc/articles/PMC8523531/
Luz PM, Struchiner CJ, Galvani AP. Modeling transmission dynamics and control of vector-borne neglected tropical diseases. PLoS neglected tropical diseases, 2010 4(10), e761. https://doi.org/10.1371/journal.pntd.0000761
Opatowski L, Baguelin M, Eggo RM. Influenza interaction with cocirculating pathogens and its impact on surveillance, pathogenesis, and epidemic profile: A key role for mathematical modeling. PLoS Pathog. 2018;14(2):e1006770. Published 2018 Feb 15. doi:10.1371/journal.ppat.1006770 https://www.ncbi.nlm.nih.gov/pmc/articles/PMC5814058/
Purkayastha S, Bhattacharyya R, Bhaduri R. et al. A comparison of five epidemiological models for transmission of SARS-CoV-2 in India. BMC Infect Dis 21, 533 (2021). https://doi.org/10.1186/s12879-021-06077-9
Scherer A, McLean A. Mathematical models of vaccination, British Medical Bulletin, Volume 62, Issue 1, July 2002, Pages 187–199, https://doi.org/10.1093/bmb/62.1.187
Smith AM, Ribeiro RM.Modeling the viral dynamics of influenza A virus infection. Crit Rev Immunol. 2010;30(3):291-8. doi: 10.1615/critrevimmunol.v30.i3.60. PMID: 20370636 https://www.dl.begellhouse.com/journals/2ff21abf44b19838,1629d2c3507c27c5,5aa3a295481caaac.html
Specktor, B. (2020, March 16). Coronavirus: What is ‘flattening the curve,’ and will it work? LiveScience. Retrieved April 18, 2022, from https://www.livescience.com/coronavirus-flatten-the-curve.html
Tang L, Zhou Y, Wang L, Purkayastha S, et al. A Review of Multi-Compartment Infectious Disease Models. International Statistical Review, Volume88, Issue2. August 2020. Pages 462-513 https://onlinelibrary.wiley.com/doi/10.1111/insr.12402
The Royal Society. Herd immunity in the epidemiology and control of COVID-19. SET-C-Rapid Review, November 26, 2020. Available at https://royalsociety.org/-/media/policy/projects/set-c/set-c-herd-immunity.pdf
Thomas DM, Rodney S, Nikhil V D; Swati D, Nicholas C. A Primer on COVID-19 Mathematical Models. Obesity Vol. 28, Iss. 8, (Aug 2020): 1375-1377
Tolles J, Luong T. Modeling Epidemics With Compartmental Models. JAMA. 2020; 323(24):2515–2516. doi:10.1001/jama.2020.8420
Xu Z, Wu B, Topcu U. Control strategies for COVID-19 epidemic with vaccination, shield immunity and quarantine: A metric temporal logic approach. PLoS One. 2021 Mar 5;16(3):e0247660. doi: 10.1371/journal.pone.0247660. PMID: 33667241; PMCID: PMC7935317. https://journals.plos.org/plosone/article?id=10.1371/journal.pone.0247660
Specific references from where Figures 1 to 8 were borrowed for this article
For Figure 1.
Luz PM, Struchiner CJ, Galvani AP. Modeling transmission dynamics and control of vector-borne neglected tropical diseases. PLoS neglected tropical diseases, 2010 4(10), e761. https://doi.org/10.1371/journal.pntd.0000761
For Figure 2.
Sasaki, K. (2020, March 11). Covid-19 dynamics with sir model. The First Cry of Atom. Retrieved April 20, 2022, from https://www.lewuathe.com/covid-19-dynamics-with-sir-model.html
For Figure 3:
Dias S, Queiroz K, Araujo A. Introduction to Group-Structured-Epidemic Model. J Control Autom Electr Syst 33, 23–37 (2022). https://doi.org/10.1007/s40313-021-00841-7 https://link.springer.com/article/10.1007/s40313-021-00841-7
For Figure 4:
Brand SP, Munywoki P, Walumbe D, Keeling MJ, Nokes DJ. Reducing respiratory syncytial virus (RSV) hospitalization in a lower-income country by vaccinating mothers-to-be and their households. Elife. 2020 Mar 27;9:e47003. doi: 10.7554/eLife.47003. PMID: 32216871; PMCID: PMC7556875
For Figure 5:
The Royal Society. Herd immunity in the epidemiology and control of COVID-19. SET-C-Rapid Review, November 26, 2020. Available at https://royalsociety.org/-/media/policy/projects/set-c/set-c-herd-immunity.pdf
For Figure 6:
Specktor, B. (2020, March 16). Coronavirus: What is ‘flattening the curve,’ and will it work? LiveScience. Retrieved April 18, 2022, from https://www.livescience.com/coronavirus-flatten-the-curve.html
For Figure 7:
Block P, Hoffman M, Raabe IJ. et al. Social network-based distancing strategies to flatten the COVID-19 curve in a post-lockdown world. Nat Hum Behav 4, 588–596 (2020). https://doi.org/10.1038/s41562-020-0898-6
For Figure 8: (two references)
Law, K.B., M. Peariasamy, K., Mohd Ibrahim, H. et al. Modeling infectious diseases with herd immunity in a randomly mixed population. Sci Rep 11, 20574 (2021). https://doi.org/10.1038/s41598-021-00013-2
Xu Z, Wu B, Topcu U. Control strategies for COVID-19 epidemic with vaccination, shield immunity and quarantine: A metric temporal logic approach. PLoS One. 2021 Mar 5;16(3):e0247660. doi: 10.1371/journal.pone.0247660. PMID: 33667241; PMCID: PMC7935317. https://journals.plos.org/plosone/article?id=10.1371/journal.pone.0247660