As an aspiring scientist, I look to encourage as many people as possible to read what knowledge I can share. Technology has made that incredibly easy, as proven in history by the boon caused by the printing press. A huge proponent of sharing information is the accessibility to a wider audience, and part of that leads to a discussion on aesthetics and formatting. Even now, I’m aware of the way that each indent in this article will help make it easier for you, the reader. In science, there is so much data and foundations to cover to be able to support all of these knowledgable ideas and to get to that quicker, the LaTeX Project has made it easier to streamline all of this together so that scientists can do what they do best – share their knowledge. Now, I hope at this point you’re aware that the LaTeX project has nothing to do with gloves commonly adorned by doctors, or the red suit that Velma (our new lesbian icon) wore in the Scooby-Doo live-action movie. If not, let me explain. From the site itself, “LaTeX… is a document preparation system for high-quality typesetting… often used for… technical or scientific documents,” (The LaTeX Project.org). During a semester where all but one of my professors strongly encourages submitting all work in LaTeX, and previous reports submitted under the guidelines of the American Physical Society, I felt it part of my duty to share some wisdom on the subject of writing in LaTeX.
To start, I use the online tool Overleaf to work in LaTeX, but there are other options such as TeX maker to start your LaTeX journey. My personal preference is Overleaf, but TeX maker may be helpful if you often find yourself without internet connection and still needing to edit your .tex files.
When creating a new project, I try to keep in mind what my purpose for the document is, and if I need a specific template (either offered through Overleaf or some I have made on my own). Often, I just make a copy of the template I have made for homeworks and continue editing it to the specifications of the class I am using it for. Othertimes, I’ve used some of the resume templates to try my hand at that. Of course, each project is different, so its good to experiment on your own with different possibilities!
In all projects, there exists the title and metadata, where I can note that I am the author, list co-authors, the date, and more, all contained within the preamble section. The preamble section is where the outline of the formatting is, and a bank for all the tools you may need as you go. One of the most useful parts of the preamble is the selection of packages you include, as it widens your ability in what you’re able to accomplish in the document. For example, if you would like to show images, there’s a package called graphicx to help neatly organize the image onto the document and minimize the struggle of neatly fixing it in place. As a physics major, the packages I might use most often are: amsmath, amsfonts, amssymb, graphicx, physics, sinunitx, mathtools, verbatim, and more. You may find some other helpful packages for your own use! Moreover, the preamble is where it is stated what class the document falls under – such as article, report, book, and so many more options with even more available modifications.
Then, the document begins. Literally. The first environment, typically indicated with the “\begin{ }” (and “\end{ }”) command, is introduced immediately after the preamble, as the document is its own environment. Whatever is typed outside of the environment will not directly be reflected onto the pdf version (unless it is formatting stated in the preamble). If I were to re-create this article in LaTeX, the first thing I would do in the document environment would be to use the command “\maketitle” so that it could take the title from the preamble and format it neatly. I could also make a section called the Introduction to let you know what the paper was all about! Sections are helpful to organize the document to make it easier on the reader, and can especially be helpful for lab reports. To create sections, you’d use the “\section{}” command, where you’d put your section title in the argument of the command. For example, let’s make an Introduction:

And without touching any fonts, bold, or anything like that, we have the start of a LaTeX article!!!
Before continuing on, allow me to clear up some basic syntax of LaTeX. As we’ve seen with the “\section{}” command, we have arguments (args) that are usually represented with curly braces: {}, and in some cases extra parameters are in straight braces: []. One common example is “\usepackage[utf8]{inputenc}”, where this (as far as I know) is a basic formatting setting. With the section command, we inputted “Introduction” to the argument so that we could name the section. Additionally, like most programming languages, there is a way to put comments in the coding portion of LaTeX that doesn’t show up in the pdf version. This is very helpful to explain new commands you’ve created or directions for a template. The comment is indicated with “%”. Anything typed after this on a line will not show up until you go onto a new line. If you would like to manually create a vertical spacing delimiter (in other words, a new line), you can use “\\”. This is not indented for the next paragraphs you may start. For horizontal spacing delimiters (simlar to the tab key) you can use “&”, which you will most commonly see in creating tables. These are the most likely syntax related things you will come across (other than the escape key)!
As helpful and streamlined as this all is, many people may still prefer to use Word or Google Docs over this. So why use LaTeX? Two words. Math mode. It’s important to note that math mode has its own syntax, but it isn’t too much more! In STEM, math mode is extremely helpful because it allows you to easily format and include equations and other mathematical work.
Some common environments in math mode include equation, gather, and align. Gather and align can help a lot more when there are multiple relevant pieces of mathematical information at once so they can be formatted well. The equation environment is helpful for textbook-style math where you can choose to number each one or not!
Something else in math mode that is common, be it for a homework problem or simple discussion of the math, is using in-line math. This is where you don’t isolate the equation from the paragraphs, but simply keep it in-line with the words so that it’s all one neat paragraph. Let’s try it!
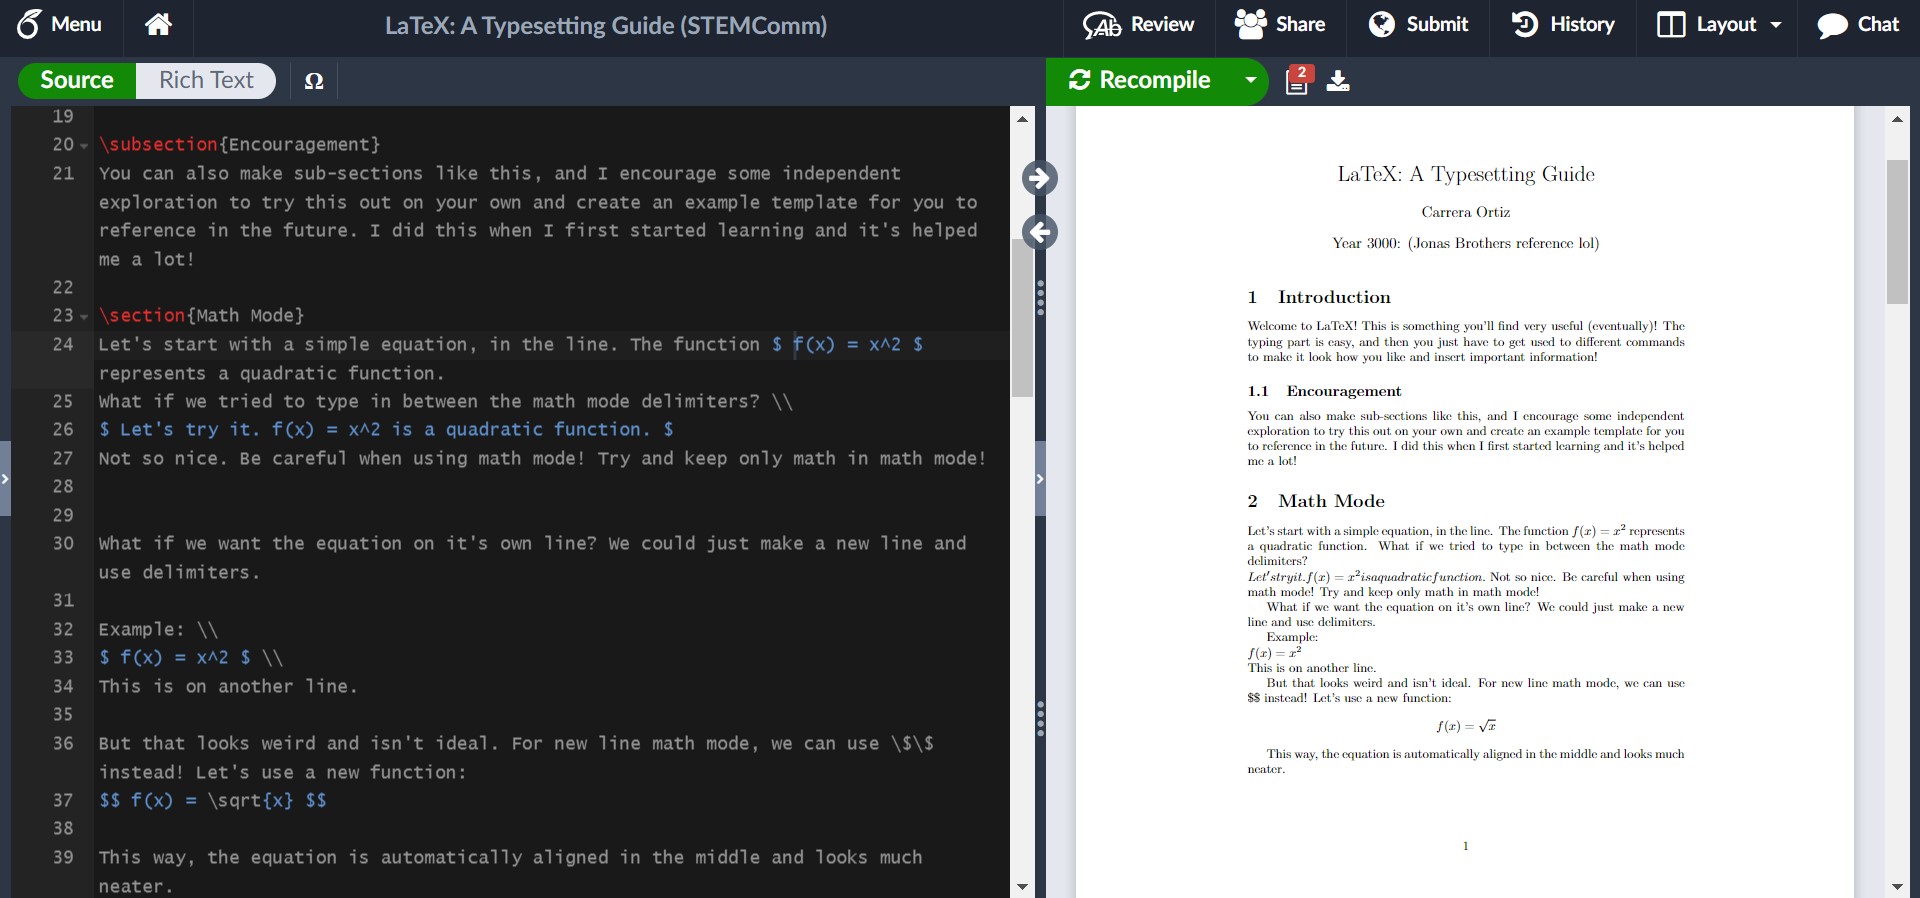
This example shows the syntax for in-line math mode and newline math mode. For in-line math, the math is wrapped around single dollar signs on either side, such as how we had $ f(x) = x^2 $. The newline math, which is good for exemplifying results, work, or important equations that will be referenced later (something the equation environment makes easy), is wrapped around double dollar signs. In this example, we had $$ f(x) = \sqrt(x) $$.
I hinted that the equation environment is numbered (like you’d expect to see in a textbook), but you can opt-out of this! Let’s see what this is like in LaTeX.
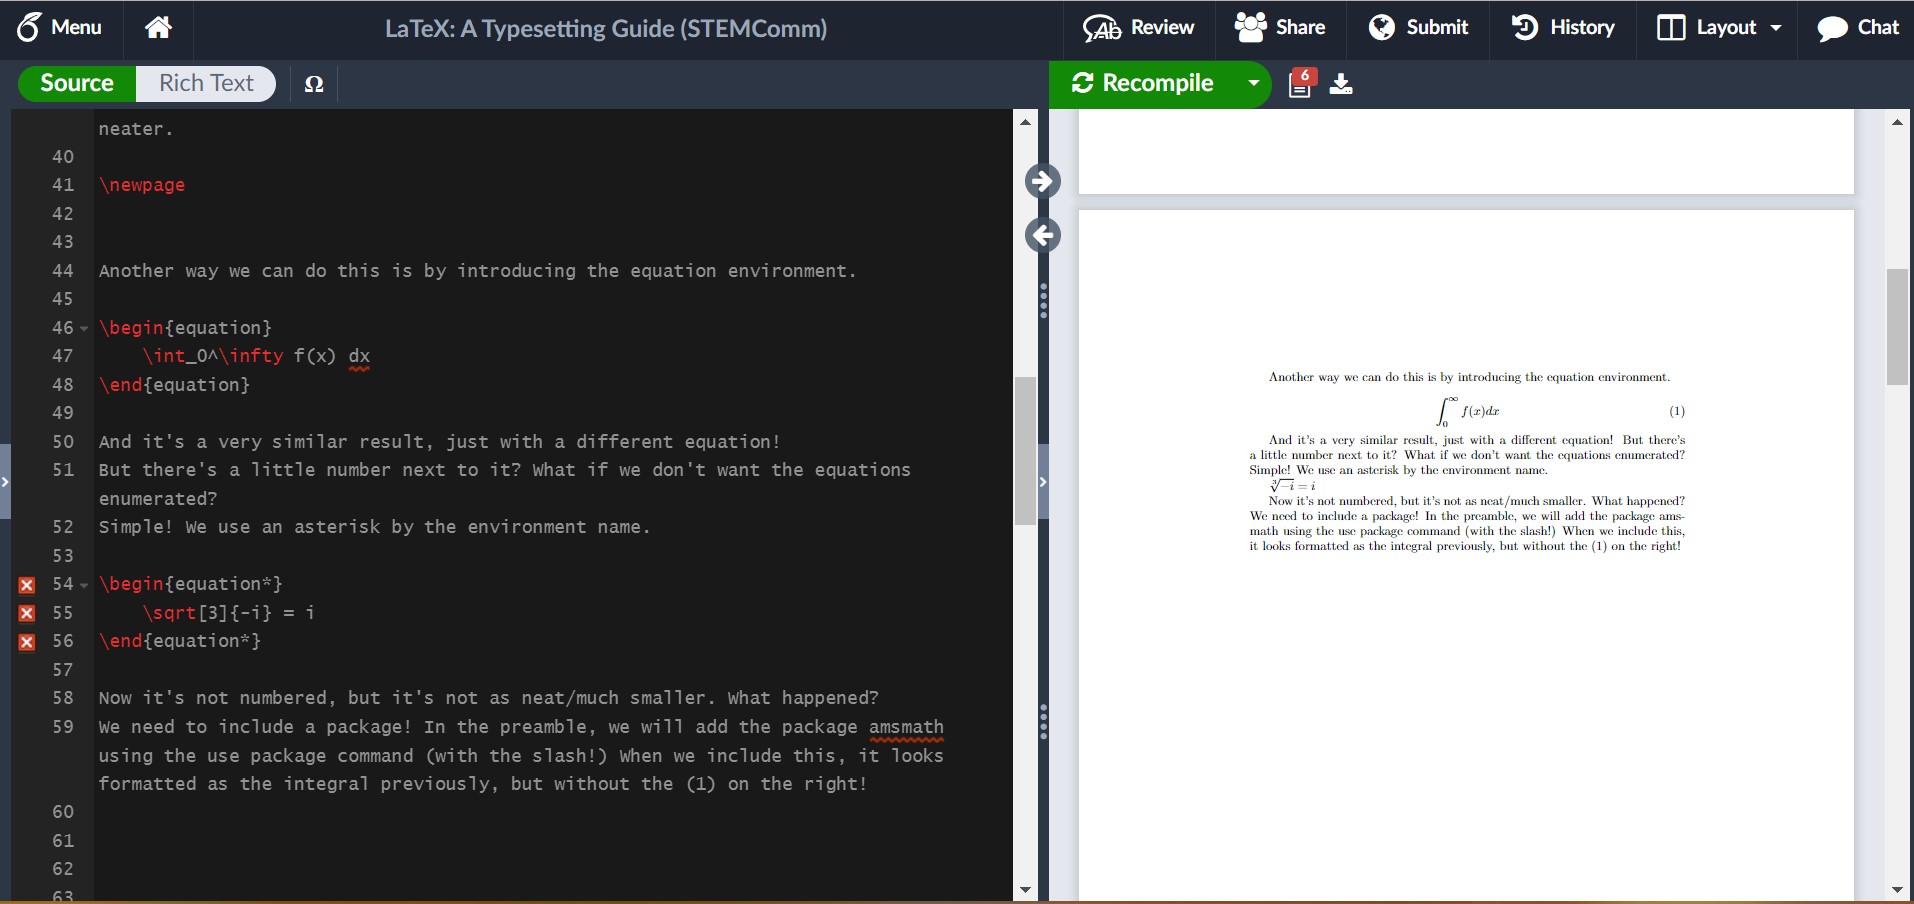 In this example, I showed us running into an issue where we needed a package. It’s not always easy to tell what the solution is to an issue, but here, google is your friend and luckily it isn’t too hard to find! I encourage you in your own example of trying out LaTeX to include the package and see what it looks like fixed!
For some common math symbols or uses, like exponents or square roots, it may be easy to just let it become muscle memory to do it, but for more complicated commands like for summations or limits, you can create a table for yourself to reference. (Hint: There’s luckily also another option I shall share if you wait a couple more paragraphs!)
Another thing you may want to include in your LaTeX abilities is including images, just as I have done in this article! It’s unfortunately not as intuitive as math mode, but Overleaf does a lot of the work for you still! Images are considered figures and are formatted through the figure environment. My general suggestion is in the file outline to create a folder for your images and upload them into there! To use the figure environment, you should insert a new package called graphicx into the preamble. By converting it to the figure environment, you’re given more control over where it is and the dimensions of your image, as well as some ability to caption and reference it. If you’re uninterested in the extra help, you can simply use “\includegraphics{yourImage}”.
To use the figure environment, you can simply type \begin{figure} and press tab, then Overleaf should finish the basics of it for you. This should look like:
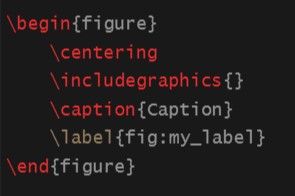
Now, I will show you what it could look like with some editing in LaTeX!
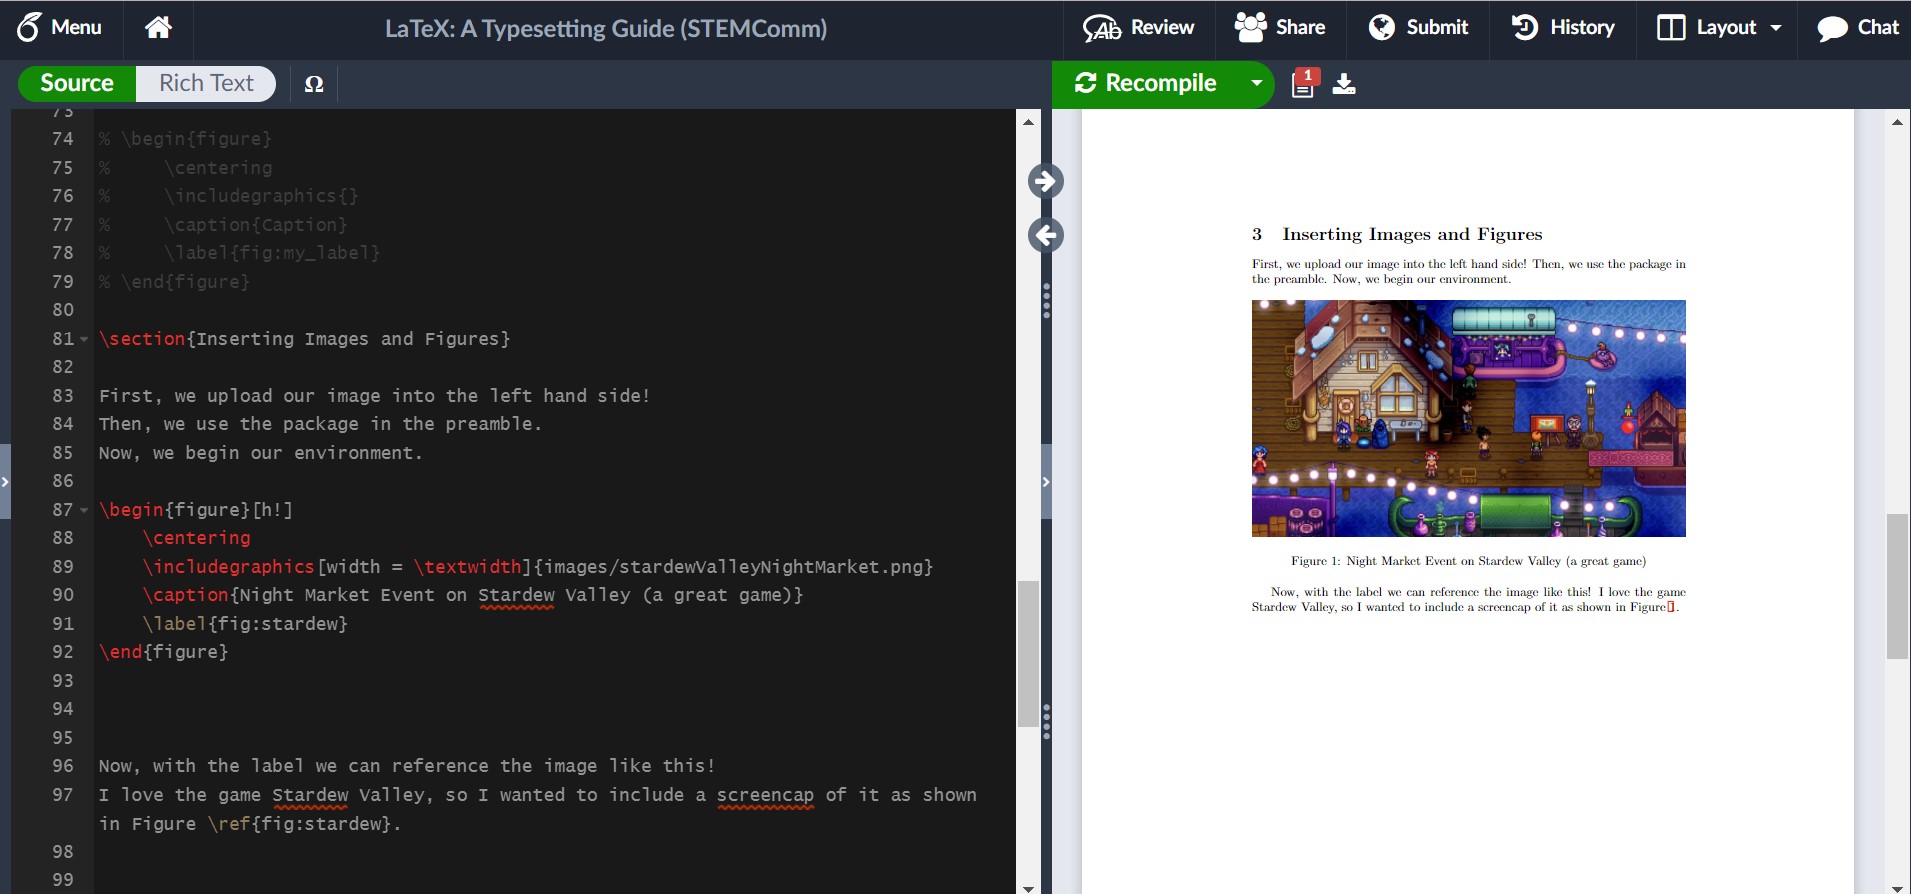
As you can see, I included some specific edits to control how I wanted the image to look. I controlled the width, what reference I used to make it easy for myself, and where it was in the article. If you want an image on a page of its own, you can use [p!] instead of [h!] next to the begin figure environment command. Additionally, there are ways to have grids or side-by-side pictures, so its something to play around with more!
Last instructions: Data Tables. Science is very reliant on data, so it makes sense that a lot of people interested in STEM might want to know how to include data tables in LaTeX. Expectedly, data tables have their own environment. The basics look like this:
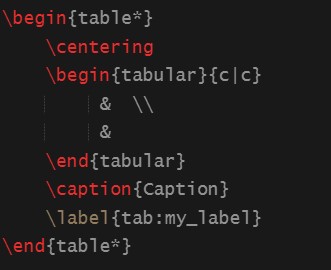
There are some recogizable things, like the centering command and the caption and label. These work just the same as the figure environment. The tabular environment within is noticably different. The columns of the table are controlled by the {c | c} arguments. If you would like more or less columns, you can alter the amount of c’s (but be sure to include the ‘|’ delimiters). The table is actually all written in the blank area with the ampersands and new line delimiters, which you may have recognized in my previous notes on syntax. Here, you may have something like:
Column 1 Title & Column 2 Title \\
data row 1 col 1 & data row 1 col 2 \\
data row 2 cold 1 & data row 2 col 2
to showcase your data. I would experiment with this on your own! For example, you can look at the Pokedex and list some Pokemon and their types/health/attack and more to try it out! It gets a little tiring, but eventually I’ll share some nice resources to make this easier as well!
Now, with some nice writing and composition skills, plus the ability to insert some familiar math into LaTeX, I would like to introduce some resources that will change the life of anyone who has not already figured this out. These few resources will absolutely help anyone using LaTeX to “work smarter, not harder”.
For example, there are plenty of different symbols and functions that I might need for a paper, and it’s not always as intuitive as writing out the name of the greek symbol after the escape key (but luckily sometimes it is). This is where Detexify comes into play! There are other similar resources for equations, but I have enjoyed this one the most. Detexify allows me to draw the symbol I would like to include in my document, and not only will it show me the command for the symbol, but it will also tell me what package it belongs to and what mode it is used in. For example, if I want to indicate “there exists a real number x” symbolically, I could spend some time googling each specific thing and then write it down and hopefully remember in the future. However, through Detexify I can draw the symbols I need and find out that the symbol for a real number uses the command “\mathds{R}” in math mode through the package dsfont. I find this quicker and more helpful than just knowing the relevant command to use, and a little better than referencing a table every time! You can find this website at https://detexify.kirelabs.org/classify.html.
Additionally, data can become very length-y very quickly and make creating data tables excrutiating. Even some small tables can take a while to set up through LaTeX without a quick way to do it. However, there’s actually a convenient website where you can set up a table for any data you would like to show in a quick and easy manner (as you might in MS Word or another similar processor), then it produces the LaTeX code that corresponds with what you’ve entered. I only wish that I had found this when I was actually taking my Advanced Lab I course and didn’t spend an hour just filling in data I had written on paper into the document. You can find this website at https://www.tablesgenerator.com/.
Also, there is indeed a LaTeX wiki for any other things you may want to look at (including a section that goes in more detail on images).
The irony is not lost on me that this article sharing my LaTeX knowledge is not written in LaTeX. However, when I first learned to use it, I wrote everything out in my own personal article where I experimented with all of these things and more. It was also extremely useful for me to look back on in case there was anything I knew I had done before and just needed a quick reference on how I did it and what the result looked like. I strongly encourage everyone to practice in their own article and learn something new! Maybe, after reading this article, you’ll find you also want to share some fun tidbits of information in the neatest and best way possible: LaTeX!